Skip to content

UX Portfolio
 Leading UX for a Facial Recognition payments startup
User Research, Rapid Prototyping, Customer Journey, AB testing, Android, iOS | Head of UX @ Payface | 2020
1. Context
2. UX Problem

In a multifaceted stakeholder ecosystem encompassing both B2B and B2C interactions, the absence of a structured UX process has left us grappling with the challenge of addressing specific usability concerns. To streamline our approach and enhance user experiences, we need to develop a focused UX strategy.
Background:
Our organization operates in a dynamic environment where we engage with both business-to-business (B2B) and business-to-consumer (B2C) stakeholders. This intricate ecosystem presents a unique set of challenges in terms of user experience (UX). To date, we have not established a standardized UX process, leading to various usability issues.
Identified Usability Concerns:
3. Tackling the problem
To address these specific usability concerns, we need to initiate a structured approach to UX strategy:
4. UX Process
Through extensive discussions with diverse stakeholders and various departments within the company, I successfully cultivated a shared UX vision that fostered a harmonious culture aligning business objectives, user needs, and technical capabilities.
In this dynamic landscape, catering to two distinct sets of clients each with their unique demands, we faced the challenge of reconciling priorities. The central question became:
"What common UX aspects matter to our Customers, Business, and Payface?"

While our clients were eagerly anticipating product growth, we recognized that initiating a UX process in this case required us to begin from the delivery phase (concluding the second diamond). This approach was crucial in ensuring that the company could maintain a steady pace of delivering results.
While our clients were eagerly anticipating product growth, we recognized that initiating a UX process in this case required us to begin from the delivery phase (concluding the second diamond). This approach was crucial in ensuring that the company could maintain a steady pace of delivering results.

To facilitate this process, we harnessed the power of the UX360º View. This tool proved instrumental in engaging and aligning everyone in our organization with the overarching UX strategy.
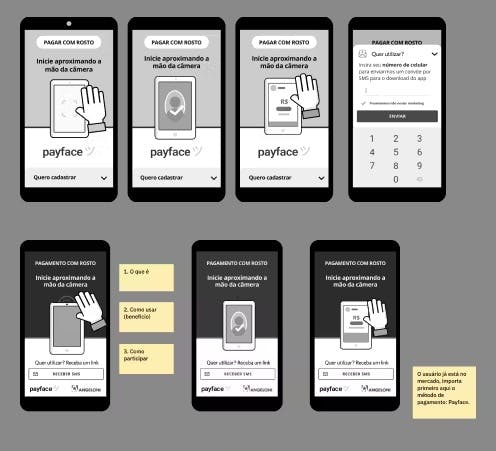
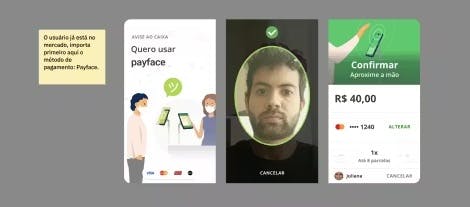
Moderated Research for Payment Experience

While conducting moderated research at our "Lab Restaurant," we had the advantage of running new A/B tests before implementing changes in a production environment. It's was important to acknowledge that the restaurant environment may not perfectly replicate the supermarket context, but it provided valuable insights into the ergonomic aspects of physical interaction during the payment process.
Enhancing Conversion Rate through Onboarding Friction Analysis

Having successfully implemented an onboarding process complete with anti-fraud checks, our organization appeared to have all the components in place for a "solid and secure onboarding" experience. However, the conversion rate at this stage was far from impressive, prompting a critical evaluation of our process to identify and resolve friction points.
Objective:
To comprehensively evaluate the onboarding process, we integrated various data sources, which allowed us to gain a well-rounded understanding of the user journey.

Analysis Approach
By combining the findings from these data sources, we ensured a comprehensive approach to analyzing the onboarding process. This multifaceted perspective allowed us to identify, validate, and address the pain points, ultimately contributing to the enhancement of the onboarding experience and, in turn, increasing conversion rates.
Obtaining Qualitative and Combining it with Quantitative for Holistic Insights

Leveraging Looker (formerly known as Google Data Studio), where Qualitative and Quantitative data were skillfully overlaid, I gained a deeper understanding of the production challenges. This process enabled the creation of a more comprehensive and refined perspective, ultimately leading to improved decision-making.
Creating a Robust ID Validation Onboarding System with an ID Analysis Table

n our quest to create a highly secure ID validation process, aiming for "bulletproof" reliability, our focus encompassed scenarios such as dealing with identical twins and guarding against potential fraudulent activities. To address these challenges, I actively contributed to the project by wireframing the system and testing it within our team.
Furthermore, I placed great emphasis on ensuring that our approach rigorously eliminated any potential for racial bias throughout our testing and implementation phases. This commitment underscores our dedication to providing an inclusive and equitable experience for all users.
Leveraged Lottie Animations for Seamless Integration
To enhance the user experience and improve information retention, we integrated Lottie animations into our product's interface. Lottie is a lightweight, open-source animation library that allows for efficient rendering of vector animations on the web, Android, and iOS.

5. KPIs and Product Outcomes
UX Strategy for B2B and B2C Environment
Usability Issue Resolution Rate: Over 50% of identified usability concerns were addressed within 3 months of the UX strategy rollout.
User Satisfaction Score (USS): Increased by 15% in B2B interactions and 20% in B2C interactions after the implementation of the UX strategy.
Project 2: Conversion Rate Enhancement
Improved onboarding conversion rate by 25% following the refinement of the onboarding flow
Onboarding Completion Rate: Increased from 60% to 85% post-intervention.
Time to Complete Onboarding: Reduced by 30%, enhancing user efficiency.
Project 3: Holistic Insights Integration
Data-Informed Decision Rate: 70% of decisions in the product team were based on integrated qualitative and quantitative data insights.
Error Reduction in Production: 15% decrease in production errors due to refined insights.
Project 4: "Bulletproof" ID Validation Onboarding
Achieved a 98% success rate in ID validation with minimal errors related to racial bias.
Fraud Prevention Efficiency: Enhanced fraud detection accuracy by 20% through improved onboarding processes.
User Experience Inclusivity Score: Rated at 90% for inclusivity, specifically in eliminating racial bias during testing.

Thanks!
Want to print your doc?
This is not the way.
This is not the way.

Try clicking the ⋯ next to your doc name or using a keyboard shortcut (
CtrlP
) instead.